Image Charts
Image based charts via API, data included
Our simple but powerful image based charts work great on any platform or browser (yes, even IE6). These charts are incredibly versatile and are used in a wide range of scenarios. The easy to use API interface gives you the freedom to customize your charts on the fly and of course institutional grade data is included.
Below are some live examples along with some code to get you started.
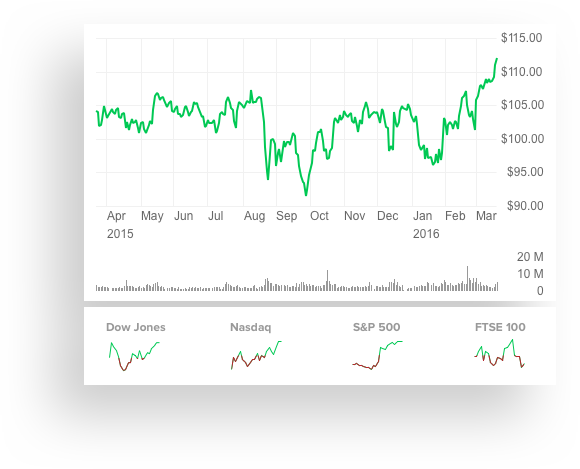
Price Charts
Our price charts provide you simple easy to read financial information on a well labeled chart. With a wide range of style inputs you have the freedom to customize the charts to fit your needs. The below demo gives only a small sample of the customizable options. Have a look at the documents to see everything else it can do.
Demo
Code Sample
In general, APIs are incredibly flexible, this code sample shows one way you could implement a call to the price chart API. More code samples are available on the documentation page along with a full list of parameters.
View Documentation
<!DOCTYPE html>
<html>
<head></head>
<body>
	<!-- Target where chart will load -->
	<div id="response"></div>

	<!-- jQuery to make life easy -->
	<script src="https://ajax.googleapis.com/ajax/libs/jquery/2.1.4/jquery.min.js"></script>

	<script type="text/javascript">
		// Set the auth token
		var token = "demo-token";

		// Set the chart inputs
		var chartInputs = {
			"symbol": "AAPL",
			"exchange": "NSQ"
		};

		// Stringify & Encode Inputs
		var encoded = encodeURIComponent(JSON.stringify(chartInputs, null));

		// Create API call
		var url = "https://api.wallst.com/apiman-gateway/MOD/chartworks-image/1.0/Chart/price?inputs=" + encoded + "&access_token=" + token;

		// Append to our target
		$("<img />").attr("src", url).appendTo("#response");

	</script>

	<noscript>Please enable Javascript</noscript>
</body>
</html>
Spark Charts
Spark charts are great for small placements where you’re looking to add small meaningful visualizations to your content but don’t want a full blown chart with x and y axis labels. Use the inputs below to explore some of the spark chart options. View the full documentation to see all of the available parameters.
Demo
Code Sample
This code sample shows one way you could implement a call to the spark chart API. More code samples are available on the documentation page along with a full list of parameters.
View Documentation
<!DOCTYPE html>
<html>
<head></head>
<body>
	<!-- Target where chart will load -->
	<div id="response"></div>

	<!-- jQuery to make life easy -->
	<script src="https://ajax.googleapis.com/ajax/libs/jquery/2.1.4/jquery.min.js"></script>

	<script type="text/javascript">
		// Set the auth token
		var token = "demo-token";

		// Set the chart inputs
		var chartInputs = {
			"symbol": "AAPL",
			"exchange": "NSQ"
		};

		// Stringify & Encode Inputs
		var encoded = encodeURIComponent(JSON.stringify(chartInputs, null));

		// Create API call
		var url = "https://api.wallst.com/apiman-gateway/MOD/chartworks-image/1.0/Chart/sparkLine?inputs=" + encoded + "&access_token=" + token;

		// Append to our target
		$("<img />").attr("src", url).appendTo("#response");

	</script>

	<noscript>Please enable Javascript</noscript>
</body>
</html>